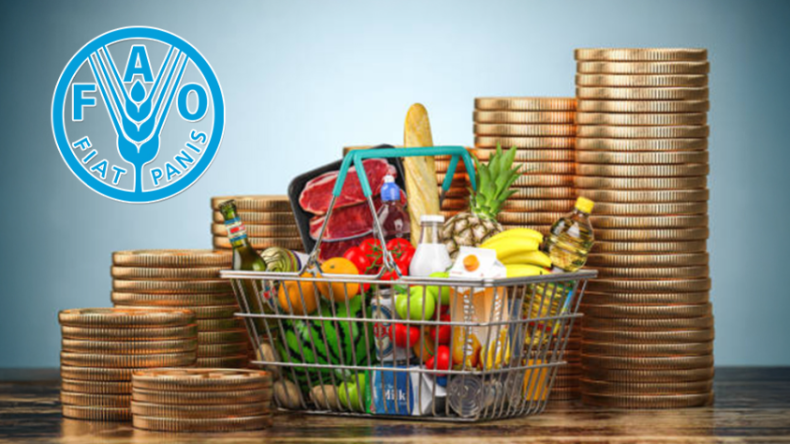
The global food price index, compiled by the Food and Agriculture Organization of the United Nations (FAO), stabilized in May 2026 at 130.8 points. This figure marks a slight decrease of 0.2% when compared to April 2026, reflecting mixed trends across various commodity groups. The overall stability observed in May 2026 comes as a notable development in the international food markets, following a period of varied price movements in key agricultural commodities.
During the month, specific commodity groups exhibited divergent price trajectories. Grain and sugar prices recorded increases, contributing positively to their respective indices and influencing the broader market dynamics. Conversely, prices for vegetable oil and dairy products experienced decreases, pulling down their sub-indices. Meat prices demonstrated near stability throughout May, balancing the shifts observed in other food categories and contributing to the overall flat performance of the main index. This combination of upward and downward movements ultimately led to the marginal decline in the overall FAO Food Price Index.
Commodity Price Movements Detailed
A closer examination of the individual commodity groups reveals the specific factors driving these trends. The grain price index increased to 114.3 points, marking a 2.6% rise from April and a 4.9% increase year-on-year. This upward movement in grain prices was broad-based, affecting several staple crops. Wheat prices continued an upward trend for the fourth consecutive month, indicating persistent demand and possibly tightening supplies in key producing regions. This sustained increase in wheat prices has been a significant factor in the overall grain market.
Corn prices also rose during May 2026, a development attributed to strong global demand for imports. This demand was met with diminished supplies from two major exporting nations, the United States and Brazil, creating upward pressure on prices. The combination of strong international buying interest and reduced availability from these critical suppliers underpinned the increase in corn values. The rice price index saw a 2.7% increase during the period, adding to the overall strength observed in the grain sector. This rise in rice prices contributed to the general upward trajectory of the cereals sub-index, noting the broad nature of the increases across various grain types.
The sugar index climbed by 7.5% compared to April, reaching its highest level since October 2025. This significant monthly jump indicates a notable shift in the sugar market, potentially driven by supply concerns or increased demand. The return to price levels not seen in over six months suggests a strengthening market for sugar.
Conversely, the vegetable oil price index decreased to 185 points, a 4.6% decline from the previous month. This reduction in vegetable oil prices provided a counterweight to the increases seen in grains and sugar, contributing to the overall stabilization of the FAO Food Price Index. The decline in vegetable oil prices could be attributed to improved supply outlooks or a moderation in demand.
Meat prices demonstrated near stability, with the meat price index reaching 130.5 points. This figure represents a minimal change compared to the previous month, indicating a relatively balanced market for meat products. Despite this monthly stability, the index recorded a 6.3% annual increase, suggesting that meat prices have trended upwards over the past year, even if the month of May saw little fluctuation.
The dairy price index experienced a decline, falling to 119.2 points. This was a 0.5% decrease from April, continuing a downward trend for dairy products. More significantly, this figure represents a substantial 22.4% reduction compared to the previous year, noting a prolonged period of decreasing prices in the dairy sector. This considerable year-on-year drop indicates a significant shift in the global dairy market dynamics, likely influenced by factors such as increased supply or softened demand.
Year-on-Year and Historical Context
The global food price index, compiled by the Food and Agriculture Organization of the United Nations (FAO), registered an approximate 2.9% increase compared to its level in May 2025. This year-on-year rise indicates a continued upward trajectory over the past twelve months, suggesting that while monthly fluctuations occur, the broader trend has been one of increasing food commodity costs. This persistent upward movement over a 12-month period is a key indicator for policymakers and consumers alike.
Despite recent fluctuations and the year-on-year increase, the overall index remained 18.4% below the record level that was established in March 2022. That peak marked a significant point in global food commodity prices, driven by various geopolitical events and supply chain disruptions that created unprecedented market volatility. The current figures reflect a stabilization that, while higher than the previous year, has not returned to the unprecedented highs observed two years prior. This provides a measure of relief compared to the intense price pressures experienced during that record period.
FAO's Food Price Index Explained
The Food and Agriculture Organization of the United Nations (FAO) publishes its Food Price Index as a monthly measure. This index tracks changes in the international prices of a basket of basic food commodities, providing a full overview of global food market trends. The FAO Food Price Index serves as a critical benchmark for assessing the state of global food security and economic stability.
The FAO's Food Price Index is constructed from five distinct commodity group sub-indices: cereals, vegetable oils, meat, dairy products, and sugar. This structure allows for a detailed assessment of price movements across key food categories, reflecting the diverse factors influencing each market segment. By aggregating these sub-indices, the FAO provides a holistic view of commodity price trends, making it an invaluable tool for analysis and forecasting in the agricultural sector. Each sub-index is carefully calculated based on a weighted average of the international prices of the commodities within that group, ensuring a representative measure of market conditions.